Currently, the limit is set to 20 charts per reporting dashboard

Especially when a project has a lot of custom fields (for example for countries and different products) then more individual graphs are required so I’d love to be able to at least add 50 graphs.
Have not been able to find a feedback request for this yet, in case there is please let me know so this post can be merged.
13 Likes
I agree Andrea! My team is small, but as we grow so do our projects and the data we follow.
2 Likes
Thanks for providing this feedback, @Andrea_Mayer! Hopefully an increased limit for charts is something our Product team can implement in the future.
I’ll keep you posted and let you know if we have any updates 
4 Likes
Hey Rebecca
Any news about it ?
Now we can create up to 24 fields but only 20 dashboards, which is not super helpful since its always missing something.
2 Likes
Any update on this? We could really use many more dashboard charts! 20 is too little for what we are reporting on per Portfolio!
1 Like
Hi!
In order to report monthly on tasks (divided by each of 4 task priorities we have set) closed by each team member, for each of our product lines, I have 8 charts per person in a project’s dashboard.
Unfortunately there is a limit of total charts in a dashboard, thus not all members of my team can use it (or we have to switch between task asignees to see this or that user’s performance, which is time consuming and may cause mistakes).
Could you please take this restriction off, or allow more charts on demand?
Thank you!
Anna
Welcome to the Asana Community Forum @Anna_Siarkiewicz 
I have merged your post into an existing feedback request thread. Don’t forget to leave your vote there at the top of the post.
Hi! Thank you @Andrea_Mayer (I didn’t find your post prior to writing mine, sorry!)
@Emily_Roman - Please increase the dashboard charts count or implement two dimensional gadget ( X-axis custom field, y-axis custom field (sum of count).
Adding my comment here as well, having multiple graphs for me and my division is essential. We use Asana as a light ERP to manage Business Development/CRM and Production and all company tasks between and around those.
The Dashboard feature very effectively helps me asses KPIs and general progress. We have a product that is customizable between the same/similar components available from different suppliers, and I’d love to show all my suppliers my pipeline of our product specified with their equipment. At the moment I can only show two.
To be honest, I don’t see why this should be something that is constrained, given that the data is already there
2 Likes
It’s super frustrating that it’s limited to 20. Can Asana create a workaround for this? Linking toTableau dashboards is a painful exercise and you loose the “where we work” idea. Can we escalate this one, PO!
Maybe a good solve would be to add an additional Dashboard view page?
You can now create multiple “List” view tabs, why not multiple Dashboard pages each with their own charts? Focus on different aspects of a project?
2 Likes
Completely agreed that 20 is limiting to those with a lot of custom fields, and tracking up to 7 different team member’s projects within a portfolio. Would love to see a way to expand past 20 dashboards within a portfolio!
Since we can’t add more than one dashboard tab to a project or portfolio, and we can’t duplicate a portfolio with all the projects attached to it, this becomes a critical challenge for us when managing large teams and lots of projects in a portfolio under them.
Could we please have more charts/widgets or at least the ability to add multiple dashboard tabs on a project/portfolio?
4 Likes
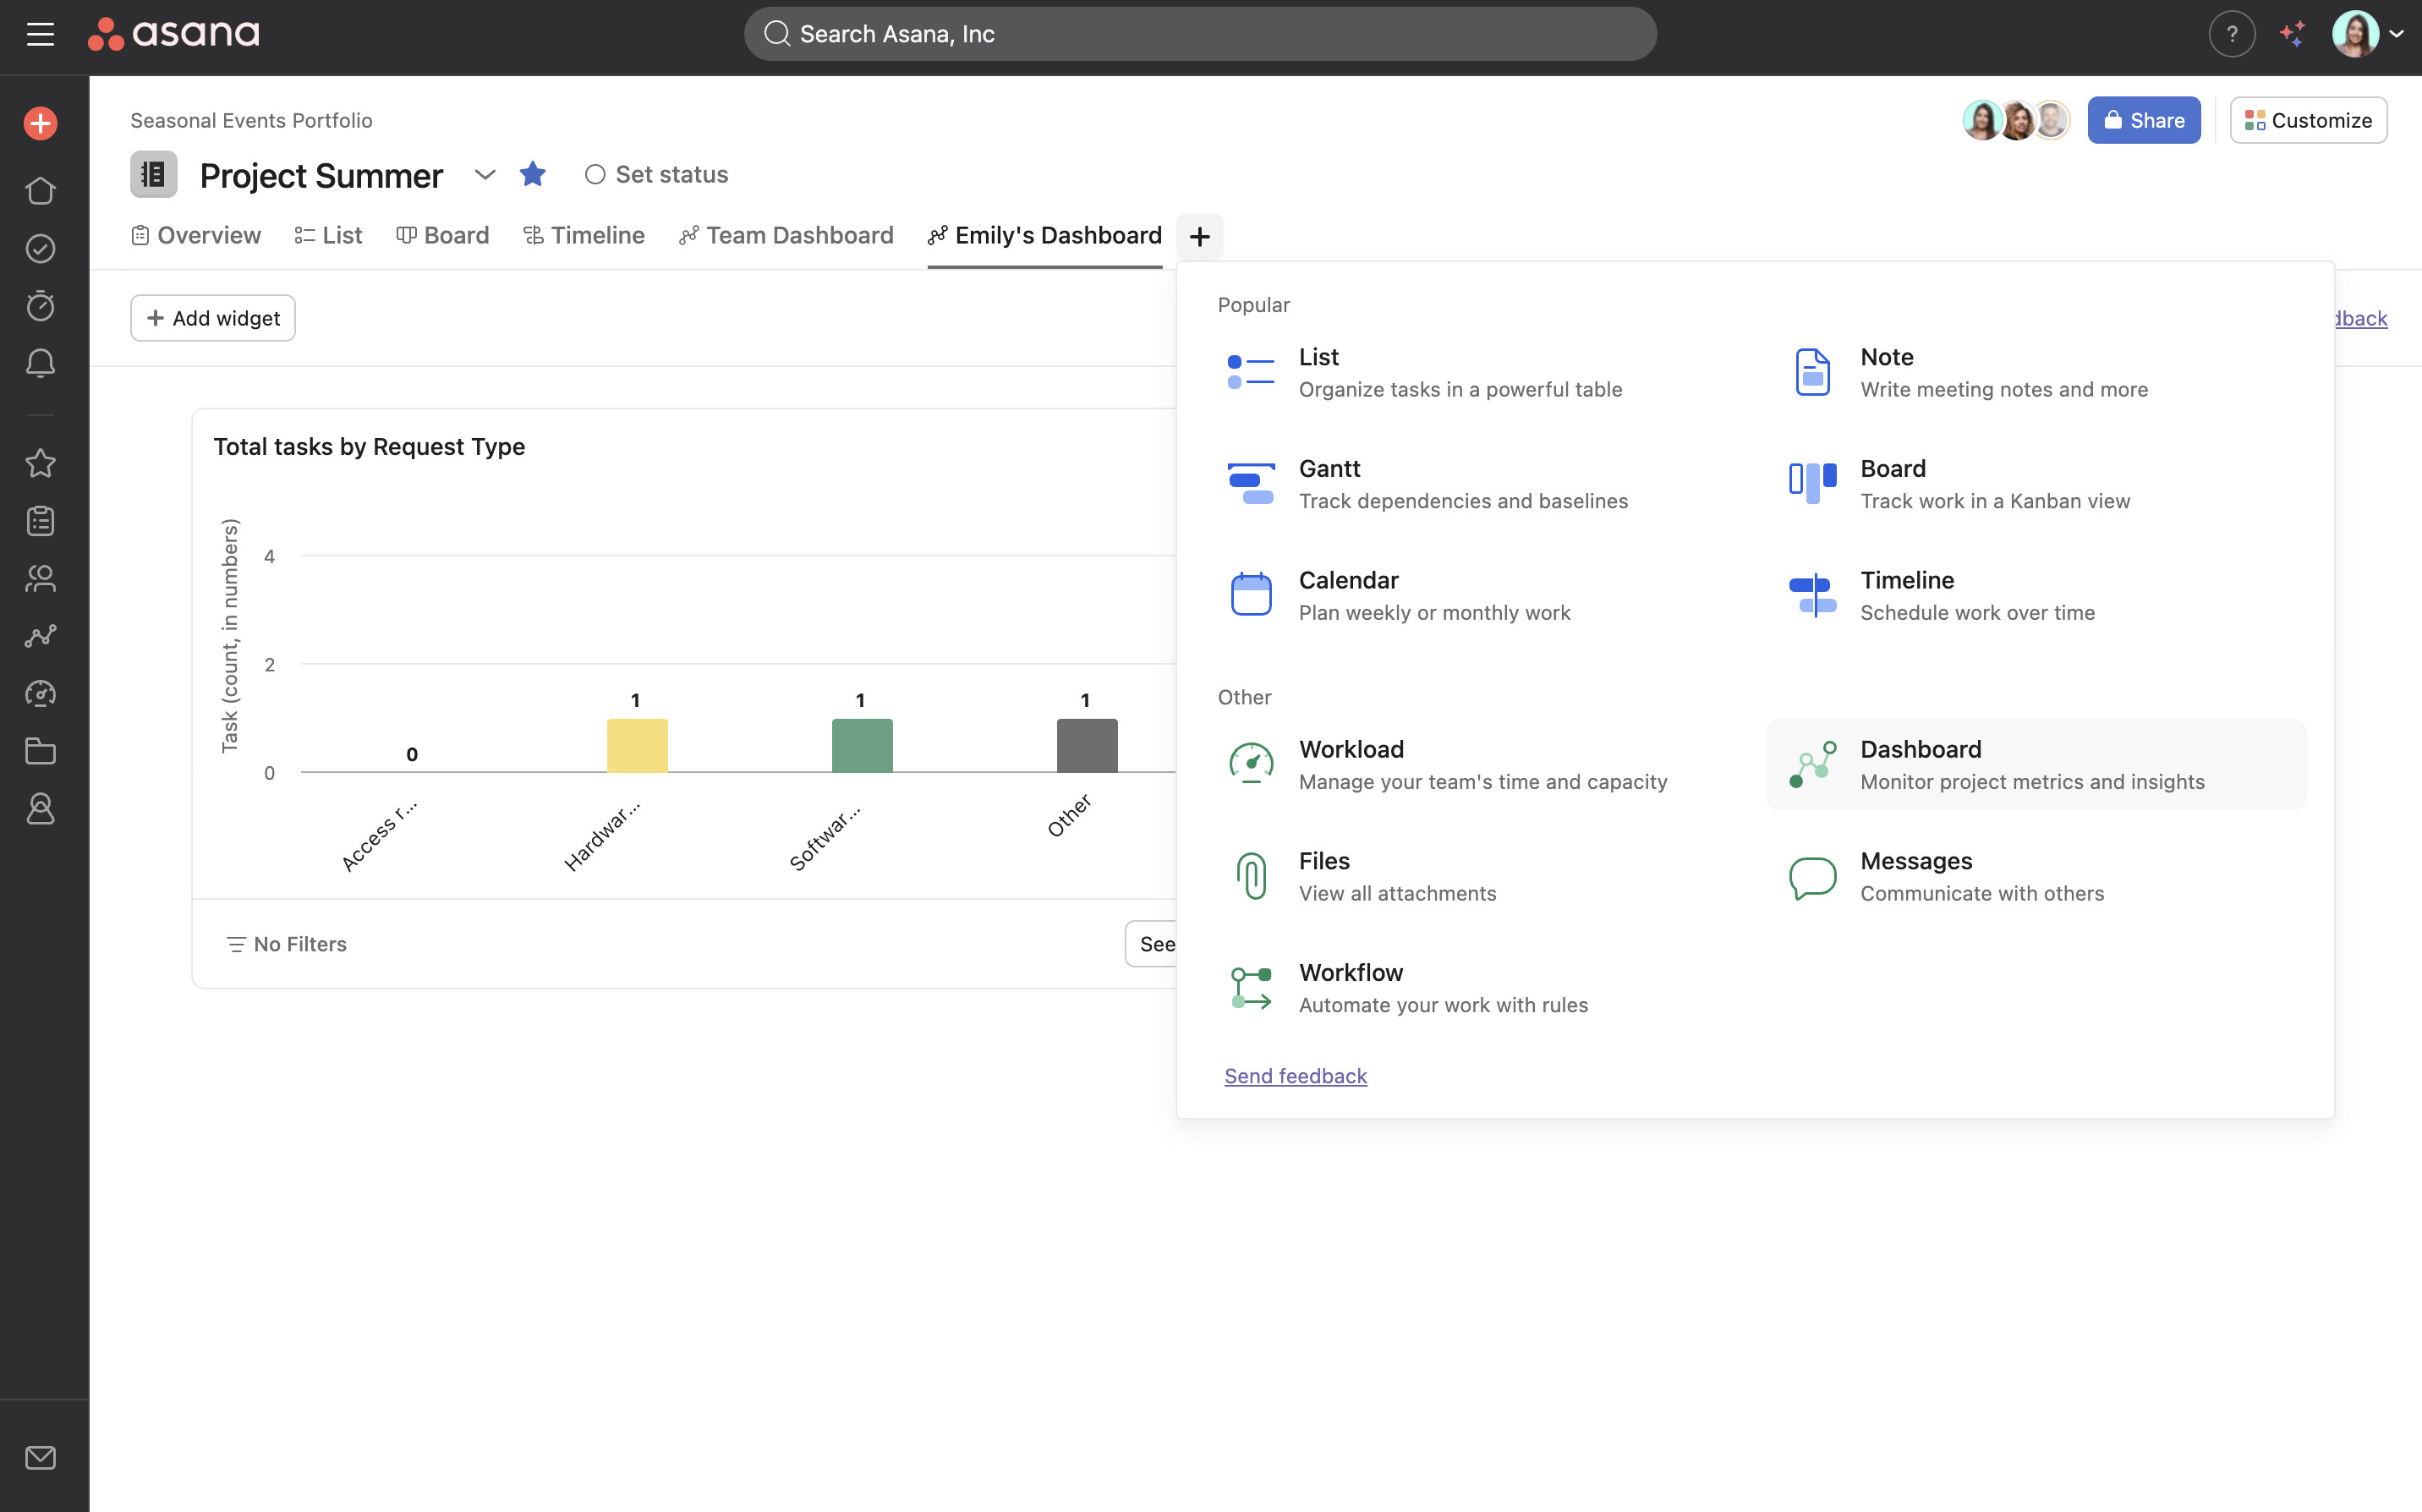
Hi everyone, just wanted to share a quick update to let you know you can now have multiple dashboard tabs on projects!
This option also allows you to add more than 20 charts to one project as you can create a new dashboard tab when fitting the limit.
1 Like