Background/Context
We have a project board where we assign team members to tasks on a weekly basis, and at the beginning of every week, each individual team member must indicate their expected time commitment for each task they’ve been assigned to, represented as a % of their available time, assuming 5 working days or 40 hours as a base (i.e. 50% allocation means 2.5 days or 20 hours, 10% means 4 hours or 0.5 days, etc). To do this, we’ve created a custom ‘number’ field, which is formatted as a %.
The problem
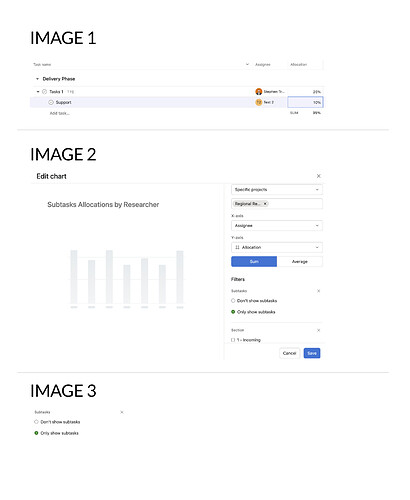
The challenge is that we often assign more than 1 team member to a task. So an individual leading a task will be added as the assignee, then for any additional team members who are ‘supporting’ on said task, we add them as a subtask. See Image 1 in screenshots file included at the end of this post.
The issue is that the assignee allocation (i.e. our custom number field) isn’t counted for subtasks when we use the dashboard or reporting features. So if I try to create a custom dashboard, and I want to create a chart to see the total allocation for any individual team member across all their assigned tasks, I can’t do this.
What I want to be able to do is see the total/SUM allocation (i.e. my custom number field) across all assigned tasks. So if a team member was assigned to 3 different tasks like this:
- Task 1 | Leading | 10% allocation (Parent task)
- Task 2 | Support | 5% allocation (Subtask)
- Task 3 | Support | 5% allocation (Subtask)
If I create a chart in the dashboard or reporting tools, currently I will only be able to count the allocation for parent tasks, which is odd because the subtasks allocation values are counted in the main board view (see above screenshot, where it says 35%).
If you refer to Image 2 in the screenshots file below, you can see a custom chart I created, which is showing the SUM of allocations (my custom field) across assignees. I can even select, Only show subtasks, unfortunately, Asana doesn’t seem to recognize the subtasks value for custom fields here.
Requested solution
The most ideal solution would be that, when creating charts in the Dashboard/Reporting tools, you allow users to SUM the value of a custom field (e.g. a number) for BOTH parent tasks and subtasks. If you refer to Image 3 in the screenshots file below, you can see the existing setting to filter by subtasks in the dashboard tool. What would ve great is if we can have 3 options here, which would be:
- Include parent tasks only
- Include subtasks only
- Include both parent and subtasks
Alternatively, if the above isn’t feasible, what would be helpful is if you can simply fix the current dashboard/reporting feature so it recognizes the value for subtasks. As you can see in the 2nd screenshot above, despite having selected Only show subtasks the chart doesn’t work as it doesn’t seem to recognize the custom field I created for the subtasks (which feels like a bug). So at least having this feature would be great. But ideally I’d love to be able to SUM the value of custom fields for both parent tasks and subtasks in reports/dashboards.
Thank you
