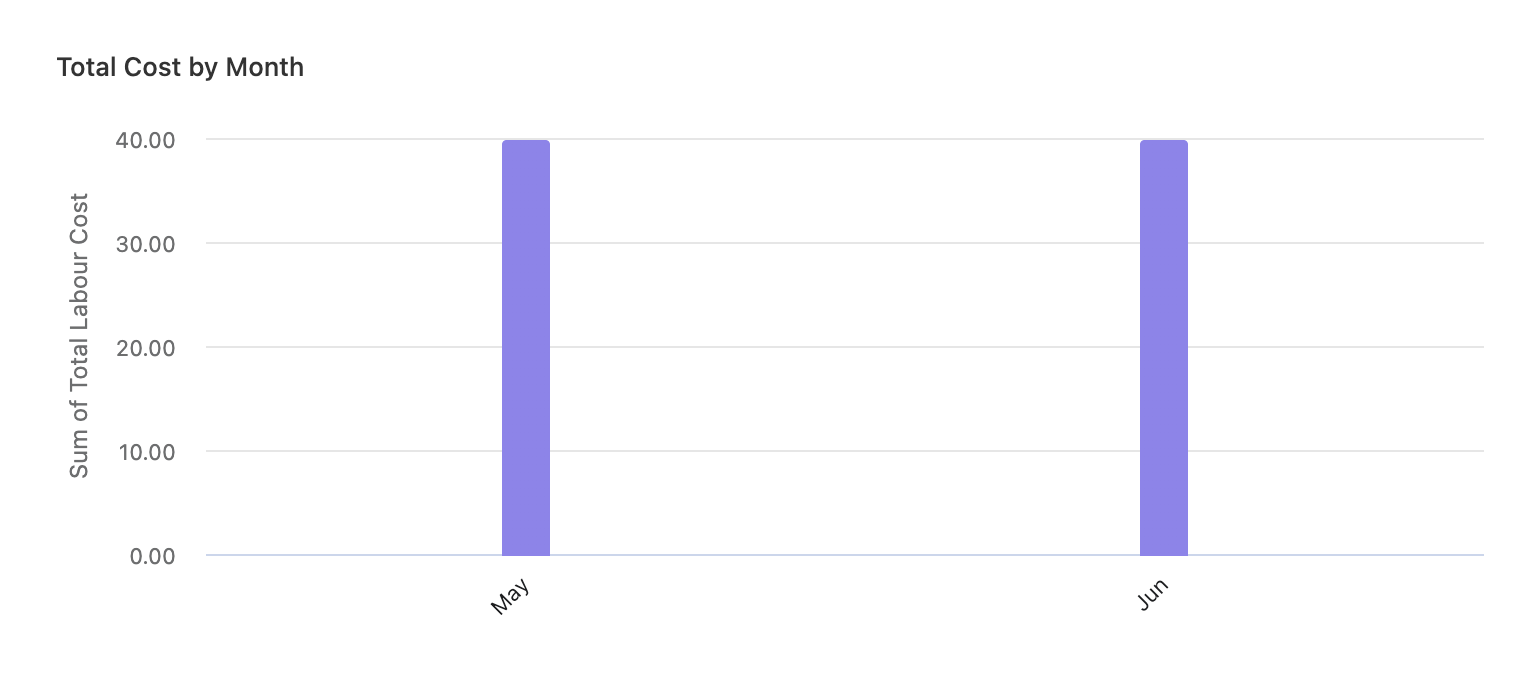
I am struggling hard here. So I have a client who I am trying to create a stacked bar chart for in Asana Reporting. Essentially, she wants to track and compare “Total Cost” (custom field) for her rolled up Portfolios by month. So the x-axis would be months, y-axis total cost, and the bar would be stacked with her various portfolios. But for some reason I can’t figure out how to stack it. Is this even possible? Here is a screen shot of what I currently have.
Hi,
Stacked bar chart is not a chart type in Asana (yet?). You should move your request in the Product Feedback category.
Take care!
1 Like
Then how come in this Asana video it shows stacked and multi-line charts. Is there some other place you can create these types of charts using Asana data?
See approx. minute 15:40…
https://resources.asana.com/scale-summit-2021-thank-you.html?aliId=eyJpIjoiVUM3azdtTFwvQkxMQ2R6UHciLCJ0IjoiZTZuVnBqN3E2V1VORXY4ZUl0c1JQUT09In0%253D
@Viva_Automated, That video shows “new and upcoming” functionality:
https://resources.asana.com/scale-summit-2021.html
Larry
1 Like
Is this feature available yet? We have bunch of use cases for these kind of charts in Asana.
@Anup_Kumar_Ray not yet available.
Is there an ETA for the stacked bar shown in video? It would make reporting dashboards a lot more useful instead of several line graphs you have to eyeball
Heads up on this topic.
Would be so useful in everyday reporting
Updates?
Any Updates here? We are desperately waiting for this feature too…
While we wait Asana to provide stacked bar charts, I suggest taking a look at the Analytics & Reports by Screenful. It’s an add-on to Asana that allows creating advanced charts, including stacked bar charts. Here’s an example chart:

You can learn more about the add-on and signup for a free trial to give it a try!
Is there an expected release date for this feature?
Asana doesn’t communicate on their roadmap
Adding my vote here, my org sorely needs this functionality, as our reporting is extremely clunky without it
2 Likes
Also hoping this will come soon, @Stephen_Li ! It’s loooong overdue, IMO.
1 Like
Agreed along with Line Charts that display multiple lines.
2 Likes
As we started looking into dashboards based on data , we will need charts like Stacked column chart, Gauge charts, Plan on a Page (Bird on a wire) for task.
I’ve merged your post into an existing thread where you can click the title to scroll to the top and vote by clicking the purple Vote button.
Please create separate Product Feedback posts for the other chart types you’re requesting.
Thanks,
Larry
1 Like
This limitation alone is what requires us to do almost all reporting outside of Asana – very frustrating! Currently, you have to create multiple (often several) separate duplicate charts filtered by the desired field but any more than two and it basically becomes useless and impossible for the user to glean the information they’re looking for.
1 Like
Correct! We need more information and details on the same