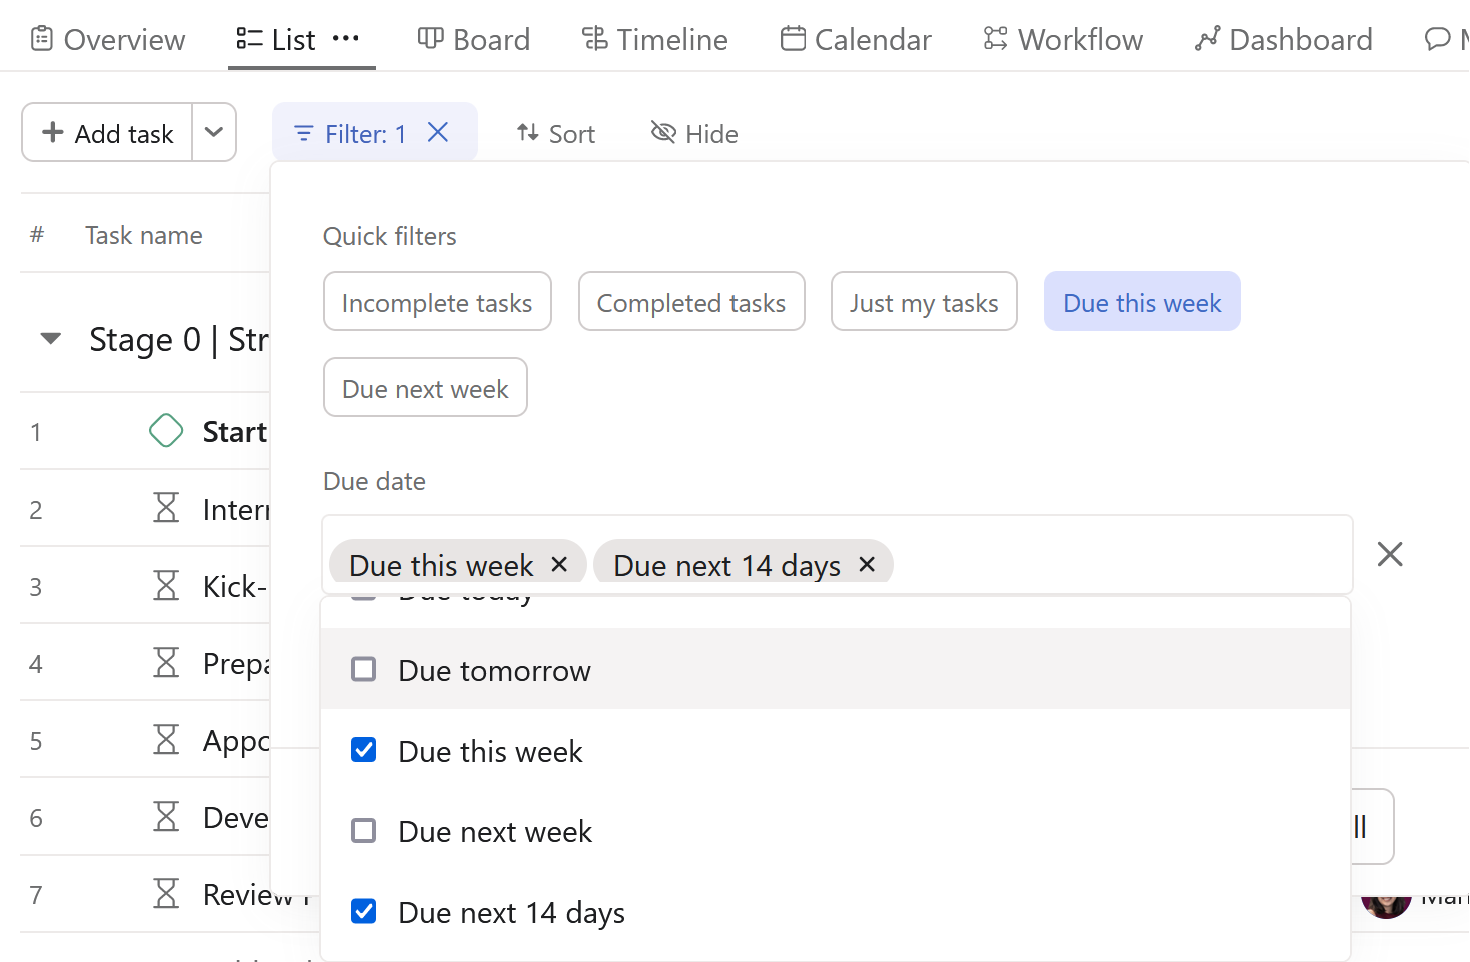
@Claudia_Ramos , unfortunately these ‘widgets’ (number charts) lack the functionality of ‘this week’ or ‘last week’ which you can actually find in a project’s filters in List view.
If you want a dashboard, then I would recommend a column (or lollipop) chart configured as such:
X-axis: Time period > Week based on task due date
Y-axis: Task count
You can set an optional filter such as incomplete tasks, if that makes sense to you.
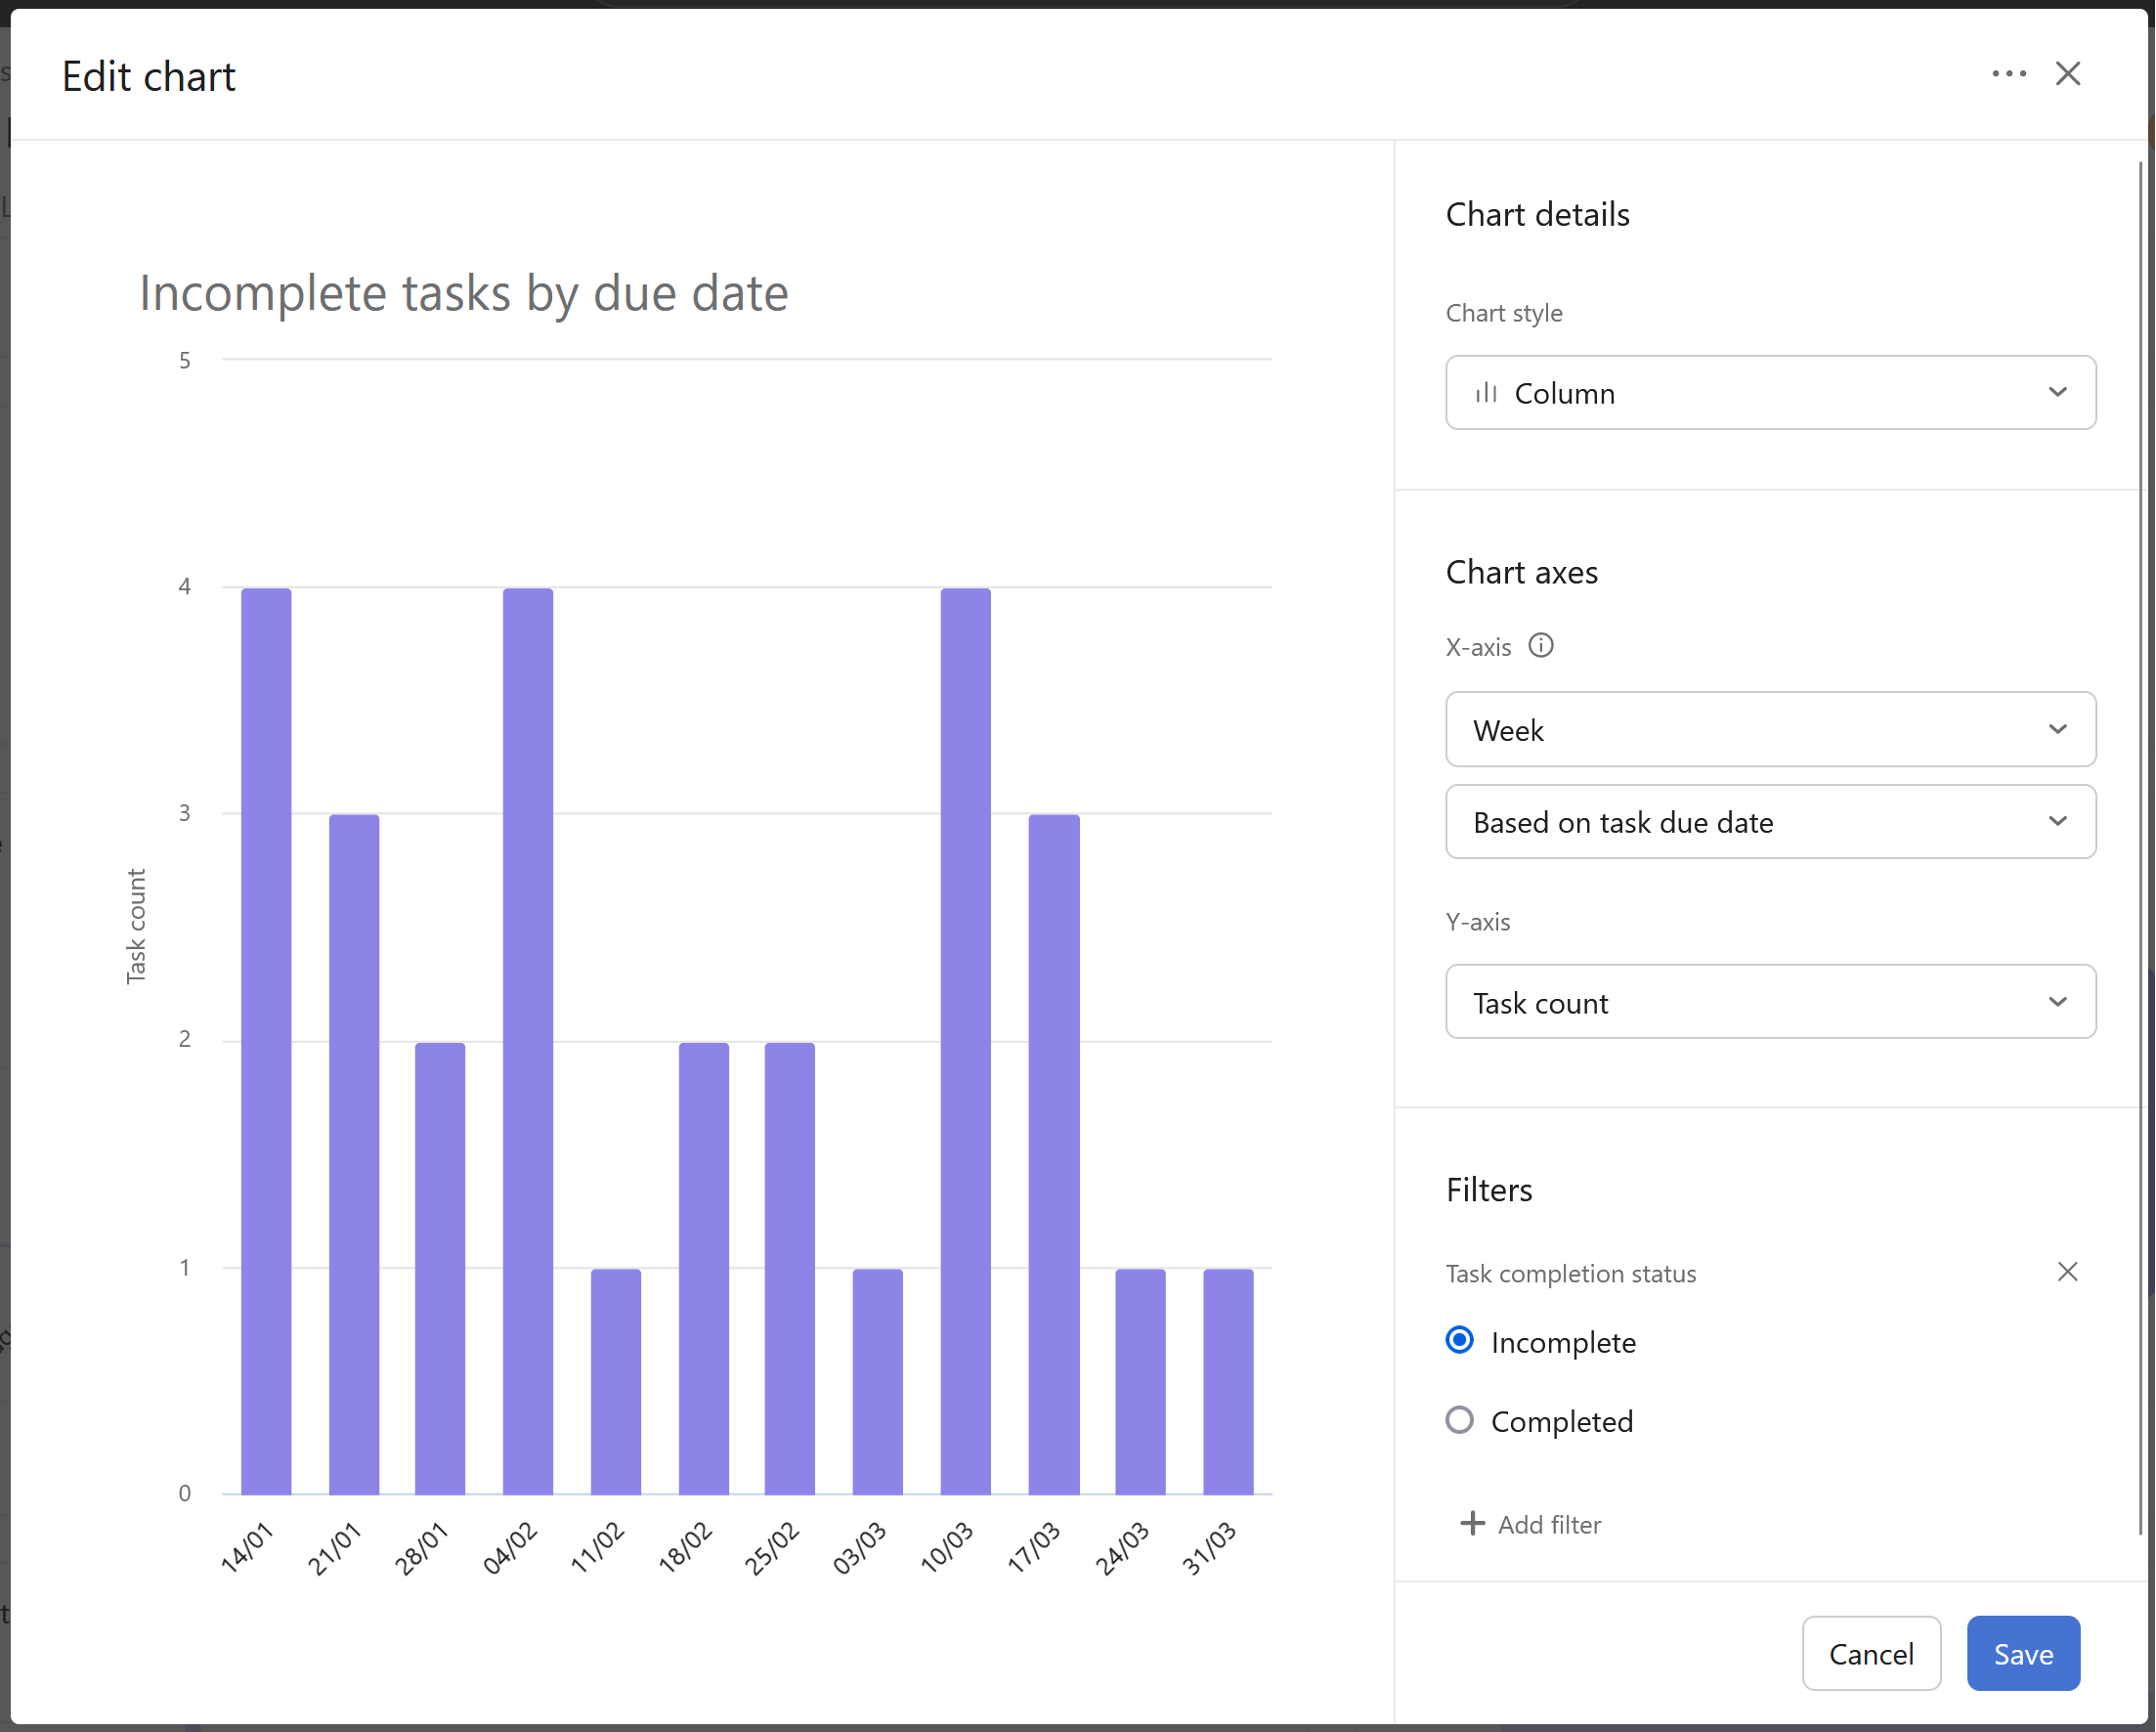
Clicking on the bars will provide you with a list of tasks.
Alternatively, you could set up your project saved view tabs to display the tasks as you want, using the filters that I mentioned above. You can make 1 copy of a list view with each filter setting (as shown below, not both, but one for each) by using the ... to also rename the List view to exactly what is shown. That way, the presenter could quickly toggle between views during their stand up. This has been very effective for clients that I’ve worked with.
For more on saved views, you may want to read through this to master how to use them ![]()